Sports Data Visualization
Goals, points, careers & salary cap
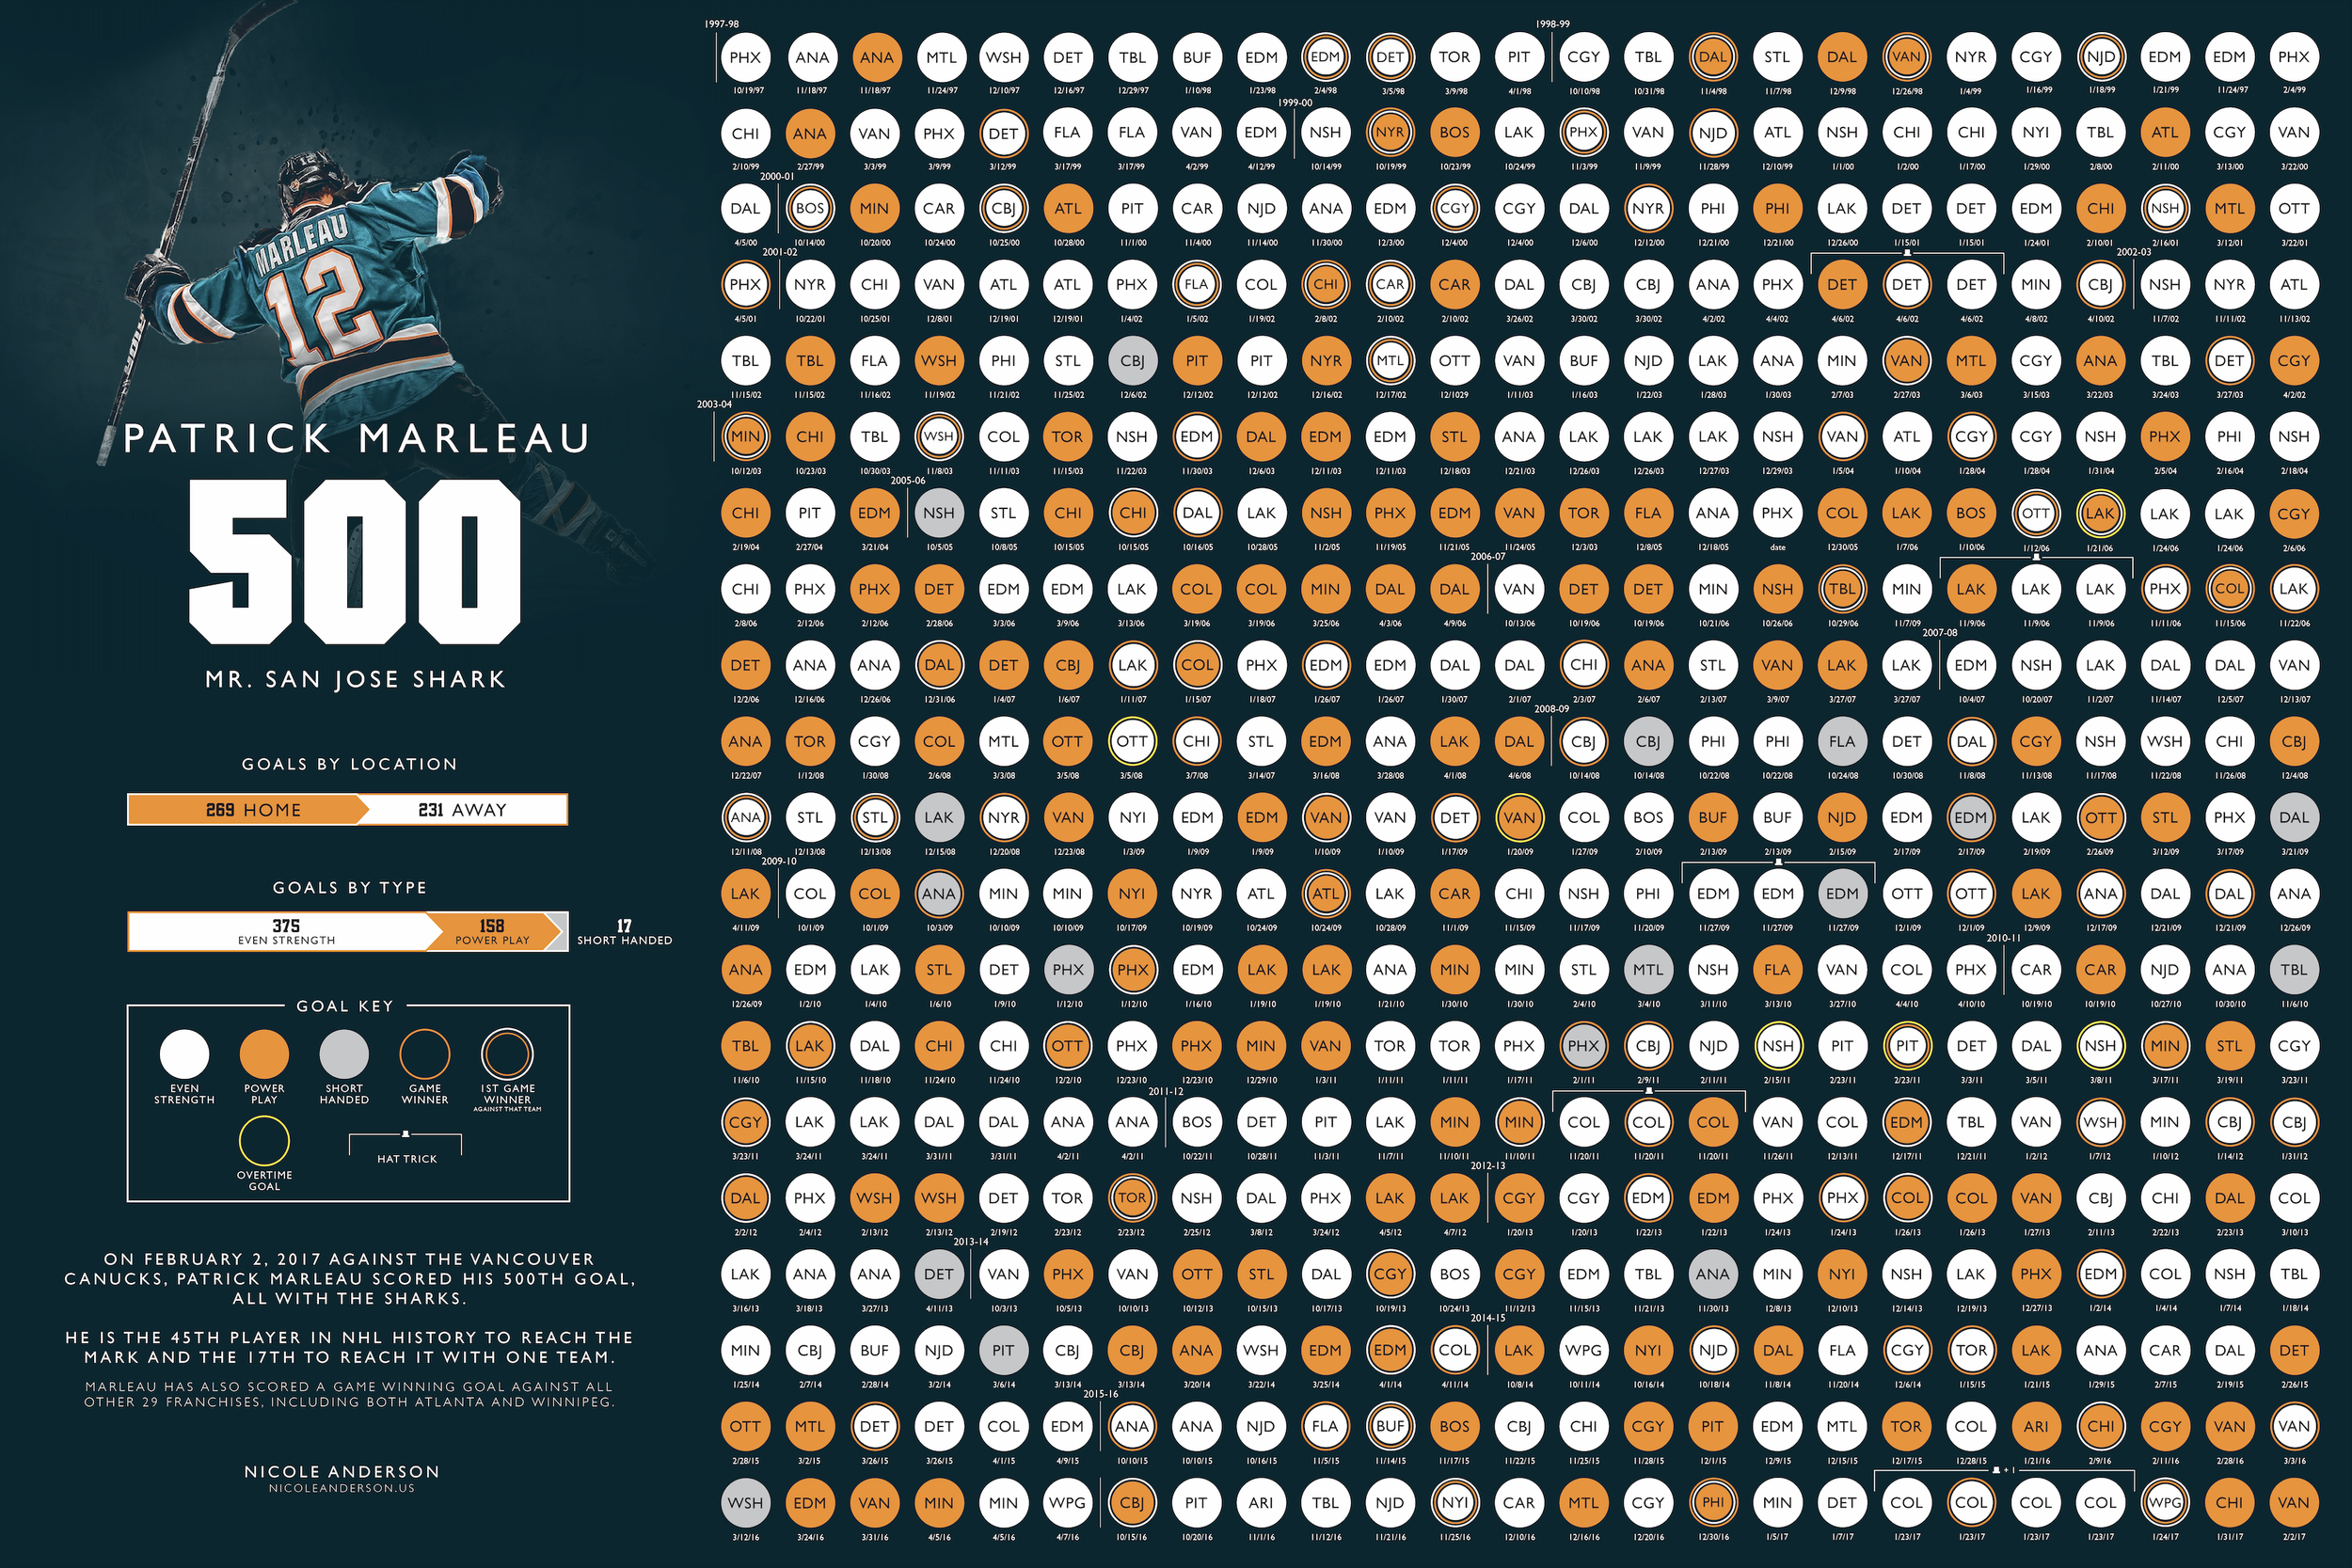
Marleau’s 500th Goal
Infographic I created honoring each of Patrick Marleau's 500 goals, a major accomplishment in the NHL. Each circle represents a goal and depicts the team it was scored against, the date and whether it was an even-strength, short-handed or power play goal. The infographic also depicts if it was a game winner, if it was the first game-winner scored against that team (because Marleau has scored a game winning goal against all 29 other franchises as of the time of his 500th goal) and if it it was scored in overtime. To the left of the circles are stats about what teams he scored against, what months and goals by season.
Thornton’s 1000th
Infographic I created in honor of Joe Thornton’s 1,000th point as a San Jose Shark. Thornton was traded to the San Jose Sharks on November 30, 2005 and as of February 8, 2019, he’s recorded 238 goals and 762 assists for 1,000 points in teal.

Joe Pavelski
Infographic depicting Joe Pavelski’s 13 year career with the San Jose Sharks.

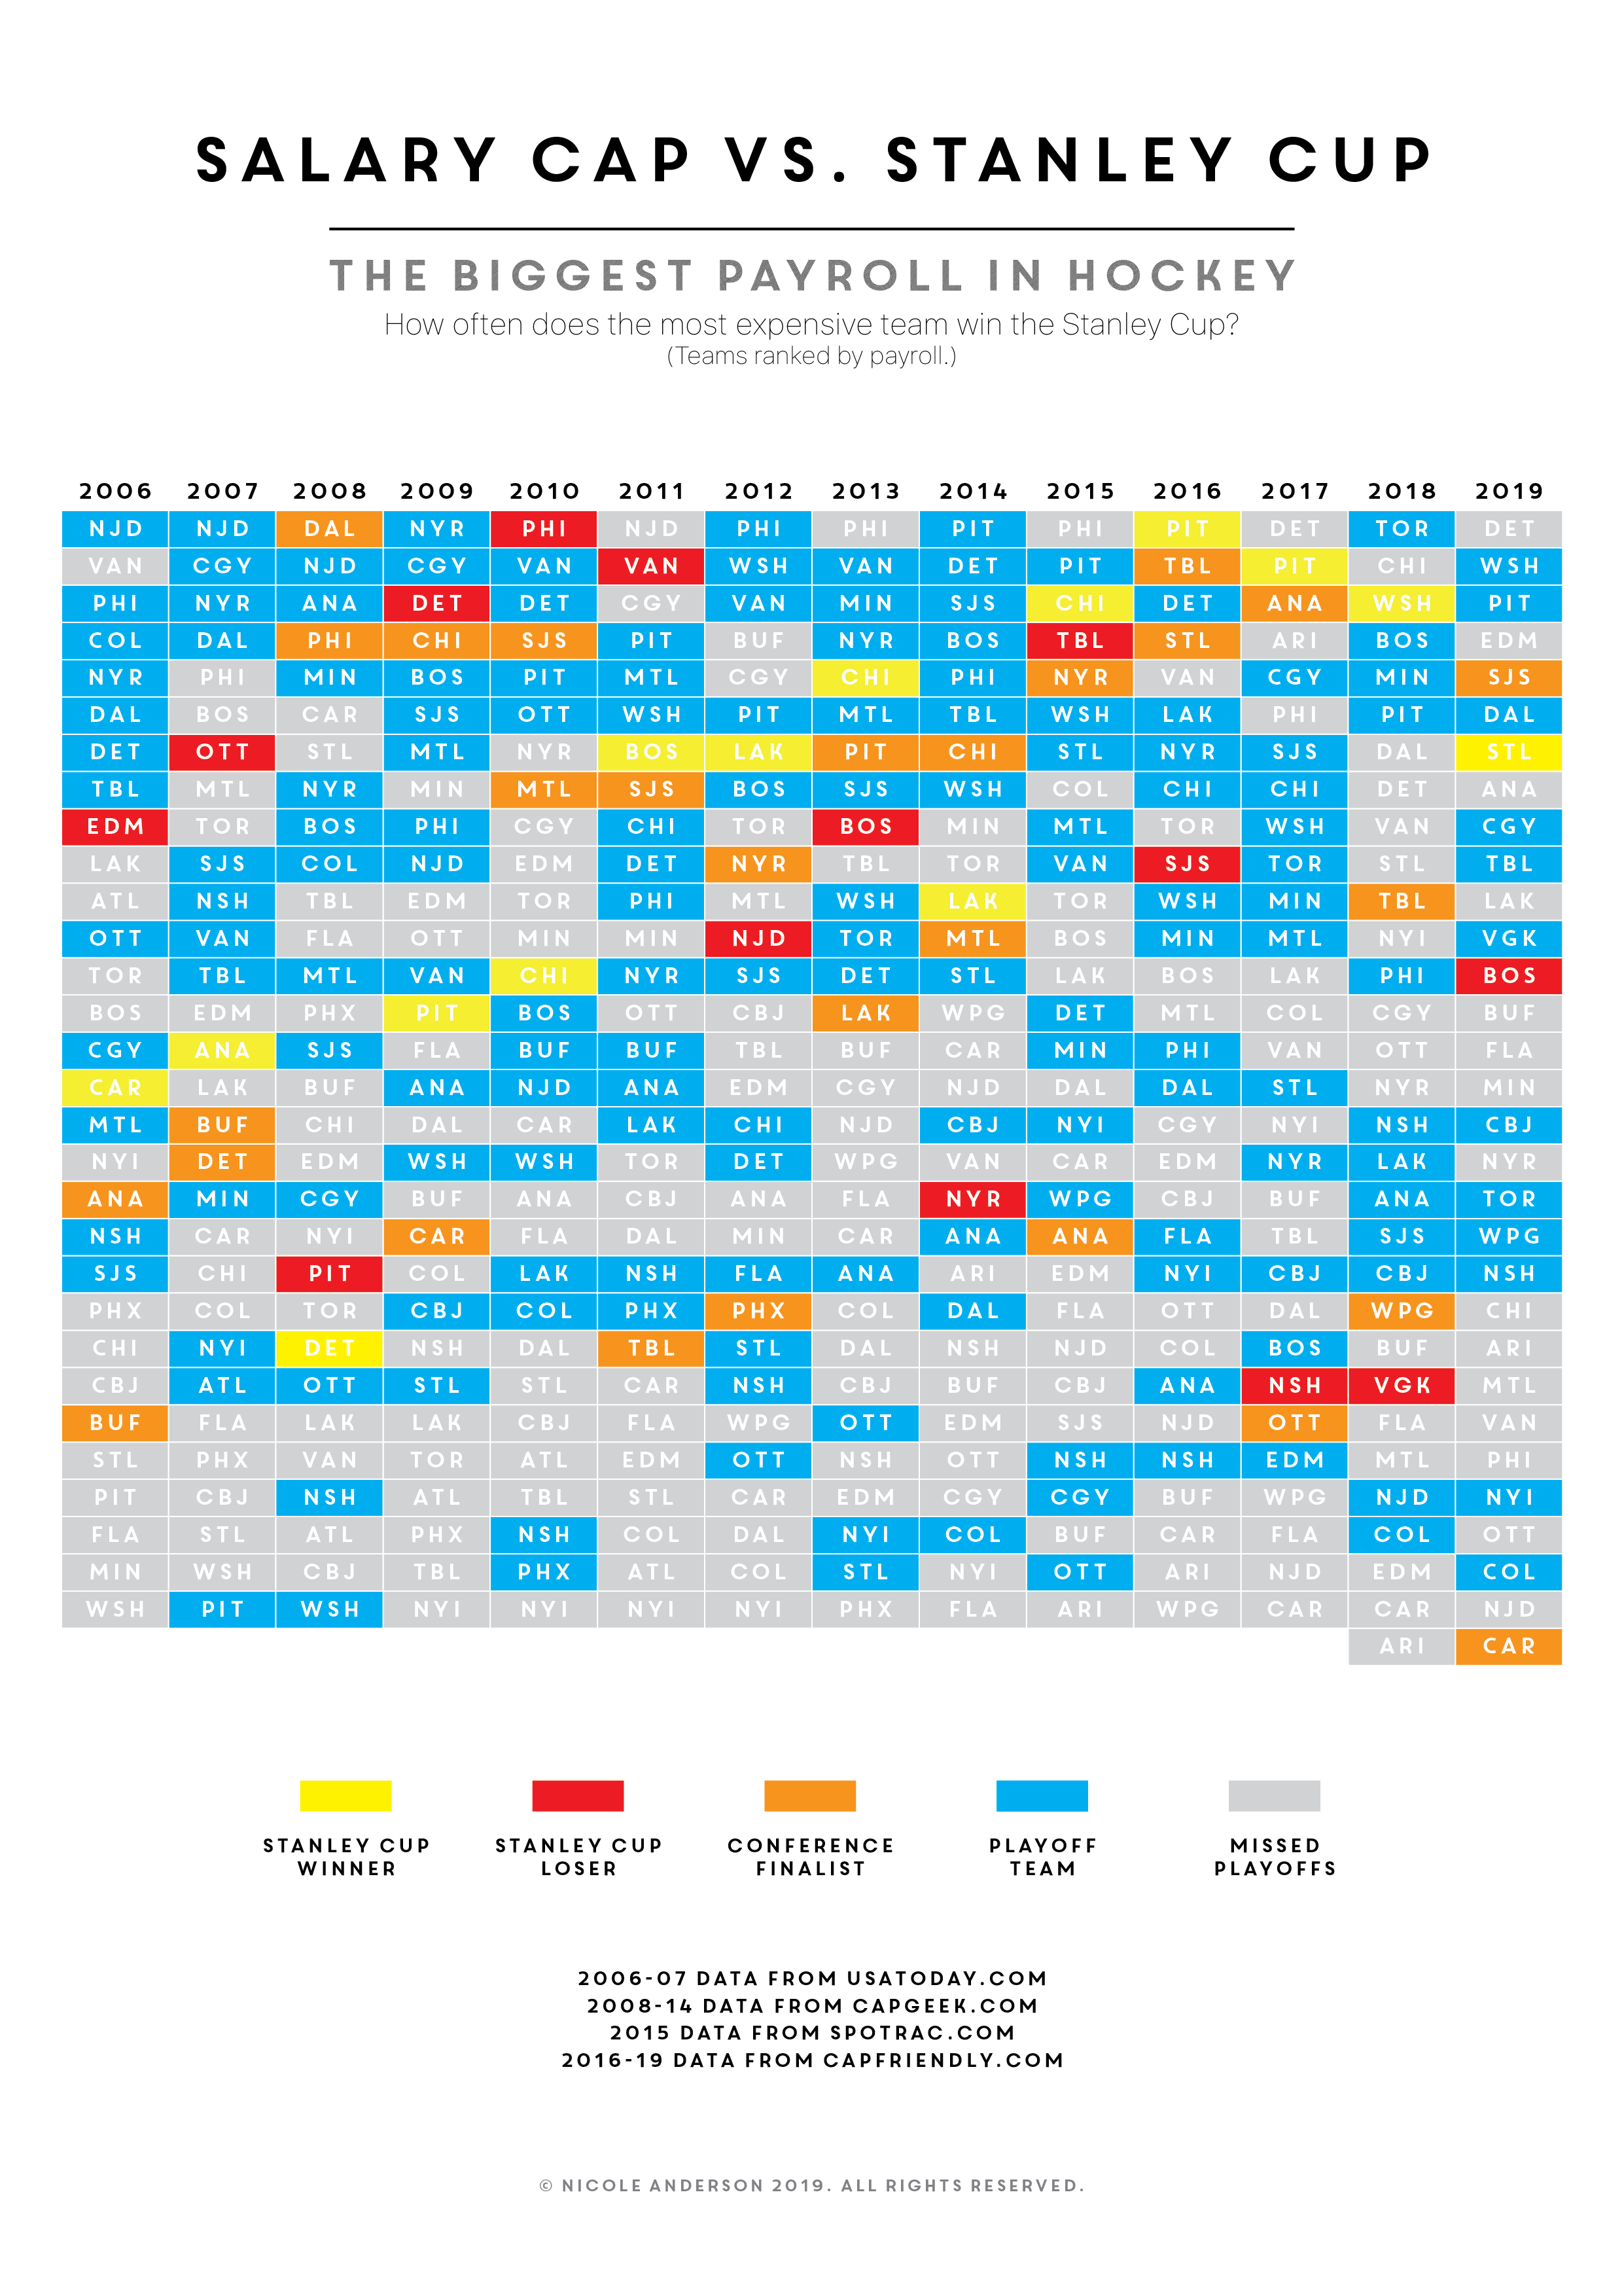
Salary Cap vs. Stanley Cup
The NHL Salary Cap was implemented following the 2004-05 NHL Lockout. Teams ordered from top to bottom in order of highest to lowest payroll and color coded depicting how each team fared that season.